Experimental Radiobiology Research Group
Optical technologies for assessing biological response to radiotherapy
In radiation therapy, standard radiation doses have been empirically determined and are delivered without consideration of in vivo disease response. There exists no accepted imaging or serologic marker proven useful for assessing radio-response during the course of therapy. Our research program involves the investigation of Raman spectroscopic methods for understanding, predicting, and monitoring the response of biological systems to ionizing radiation that is typically used in radiotherapy. The program is a collaborative effort between physics, chemistry, biology, and engineering.
People
Research areas
Typical research areas include, but are not limited to:
- Understanding cellular response to radiotherapy: Irradiated cell lines varying in inherent radiosensitivity and other biological parameters are interrogated using Raman spectroscopy, with the aim of observing and understanding the biological pathways that are responding to the radiation.
- Murine models for observation of radio-response: In vitro tumour irradiations are performed and irradiated tumour is excised and analyzed using Raman spectroscopy. Results are correlated to in vitro models.
- Automation of Raman acquisition techniques: We aim to utilize microfluidic systems to automate Raman acquisition of irradiated cells and tissues.
- Raman analysis: We currently utilize Principal Component Analysis (PCA) for the analysis and identification of biological response present within the acquired data. Current investigations involve alternate methods of analysis with the aim of enhanced information extraction.
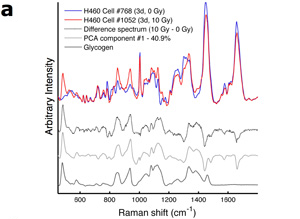
(a) Representative Raman spectra of irradiated and unirradiated H460 cancer cells. Also shown are the difference spectrum, the Principal component (PC) corresponding to radiation damage, and a spectrum of pure glycogen.
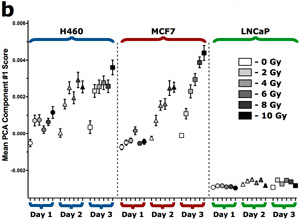
(b) Principal component scores for radiation PC component for a range of cancer cell lines irradiated between 0 – 10 Gy and data acquired between 1 – 3 days post irradiation.
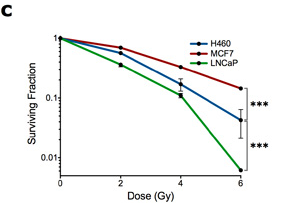
(c) Cell survival curves for the cell lines shown in (b).